How to read a pump curve and correctly size the hydraulic system.
Understanding how to read a pump curve is the first step in selecting the most suitable model, avoiding sizing errors, energy waste, and cavitation issues.
When selecting a pump for a hydraulic system — whether for a home, a well, or an irrigation system — the performance curve is the tool from which to start to make the right choice. Understanding how to interpret it is essential to:
- identify the model able to meet the system's needs while avoiding oversizing;
- prevent energy inefficiencies, benefiting both costs and environmental impact;
- ensure long service life and optimal performance of the pump, thanks to identification of the best efficiency point.
Performance curve of a hydraulic pump: a matter of flow rate and head.
As is known, the pump transforms the mechanical energy supplied by the motor into kinetic energy transferred to the fluid through the impeller blades. This energy is then partly converted into pressure energy, allowing the fluid to move through a system.
To describe the pump's behavior, two key parameters are referenced: flow rate and head.
The flow rate of a centrifugal pump indicates the volume of fluid it can move over a given time. Practically, it refers to the quantity of liquid passing through the pump per unit of time, usually expressed in liters per minute (l/min) or cubic meters per hour (m³/h). In the United States, GPM (gallons per minute) is also often used. This parameter is influenced by various factors, including the pump’s design dimensions, shaft rotation speed, and the physical properties of the fluid, such as density and viscosity. Flow rate is one of the most fundamental technical characteristics of a centrifugal pump, as it determines its ability to meet a system’s or process’s flow requirements.

The head of a pump represents the pressure difference between the outlet and inlet of the fluid, expressed in terms of height, typically in meters (m). Essentially, it indicates how high the pump can raise the fluid, converting mechanical energy into pressure energy. This parameter is crucial as it defines the pump's ability to overcome resistances along the fluid's path, such as bends, valves, piping, or distributed pressure losses. Head is thus a key factor in selecting the most appropriate pump for a specific system, as it must match the structural conditions such as pipe length and diameter, required lifting height, and fluid volume to be transferred.
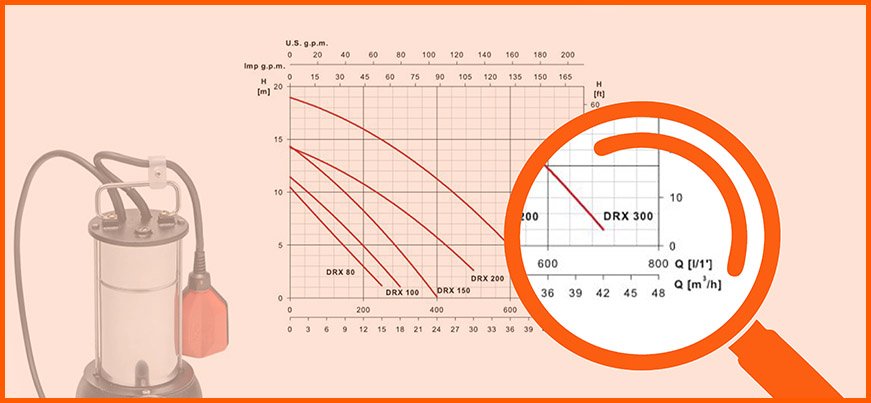
The performance curve traces the behavior of the hydraulic pump.
The behavior of a hydraulic pump, in terms of its ability to generate head at different flow rates, is described by its curve.The curve is plotted on a Cartesian plane where the horizontal axis (X-axis) represents flow rate — in m³/h, l/min, or GPM — and the vertical axis (Y-axis) represents head in meters (m).
The curve generally shows a decreasing trend: as flow rate increases, head tends to decrease; more fluid in motion means less lifting capacity per unit.
Each pump, however, has its own characteristic curve depending on several factors, including:
- impeller geometry (diameter, shape, blade angle);
- pump rotation speed;
- internal losses from friction and turbulence;
- design characteristics of the pump casing.
In all cases, the curve allows visualization of how the pump will perform at any point within its operating range.
How to select the right hydraulic pump model.
First, you must identify the required capacity and head for your system. On the performance curve graph, each point represents a flow-head combination the pump can actually provide.
Imagine needing to lift water from an underground tank to an elevated one using a pump. The data to consider are the lifting height, e.g. 15 meters, plus head losses, and the required flow rate, e.g. 12 m³/h.
This gives the operating point required by the system, independent of the pump. Then the pump must be evaluated to see if this working point lies on its curve. If the point lies below the curve, the pump cannot provide the required head at the desired flow; if the point is above the curve, the system requires less head than the pump provides at that flow. In the first case, the pump cannot overcome the system resistance; in the second, it is oversized. In summary, only if the required operating point lies on the pump’s curve is there a real balance between what the pump provides and what the system needs.
Operating point and Best Efficiency Point (BEP).
But it is not enough for the operating point to be on the curve: it should also be as close as possible to the Best Efficiency Point (BEP).
Every pump has a flow rate at which it operates optimally, with maximum efficiency. This point appears on a bell-shaped curve representing the ratio between useful power and absorbed power, as a function of flow, and is usually marked by manufacturers on the curve.
For example, imagine a hydraulic pump with its BEP between 7 and 10 m³/h, corresponding to 70%-80% of its maximum flow. If the system’s required operating point falls within this range, the pump will work optimally.
If the pump works far from this point, negative consequences arise: on the left (low flow) — vibrations, overheating, noise; on the right (high flow) — reduced efficiency, increased wear and energy consumption.
What is NPSH and why it matters.
When a pump draws in fluid, a vacuum is generated at the inlet (suction). If this pressure drops too low, the fluid may evaporate locally, forming bubbles and causing cavitation, which can seriously damage the impeller.
That’s why, especially for systems with deep suction, it's essential to consider the NPSHR — Net Positive Suction Head Required, i.e. the minimum pressure (expressed in meters of liquid column) that must be present at the pump’s inlet to avoid cavitation. It is provided by the manufacturer, typically as a function of flow.
The higher the flow rate, the higher the NPSHR the pump requires. The Net Positive Suction Head Available (NPSHA), instead, indicates the actual suction pressure available at the pump, determined by system conditions: fluid level, atmospheric pressure, suction losses, suction height. For safe operation, the NPSHA must be higher than the NPSHR, with a safety margin of at least 0.5–1 meter. Otherwise, the pump may cavitate, causing damage and performance drops.
The type of fluid also makes a difference.
Pump performance curves are developed using water, but when other fluids are involved — more viscous, lighter, hotter, or more corrosive — important variations must be considered.
Viscosity affects flow and power consumption; density impacts required head; vapor pressure changes the NPSHA value.
In such cases, standard curves must be corrected using specific coefficients, motor power must be reviewed based on the new load, and above all, pump materials must be compatible with the fluid.


